How Flex Databases Report Tool helps to get 100% of your data work
September 23, 2021
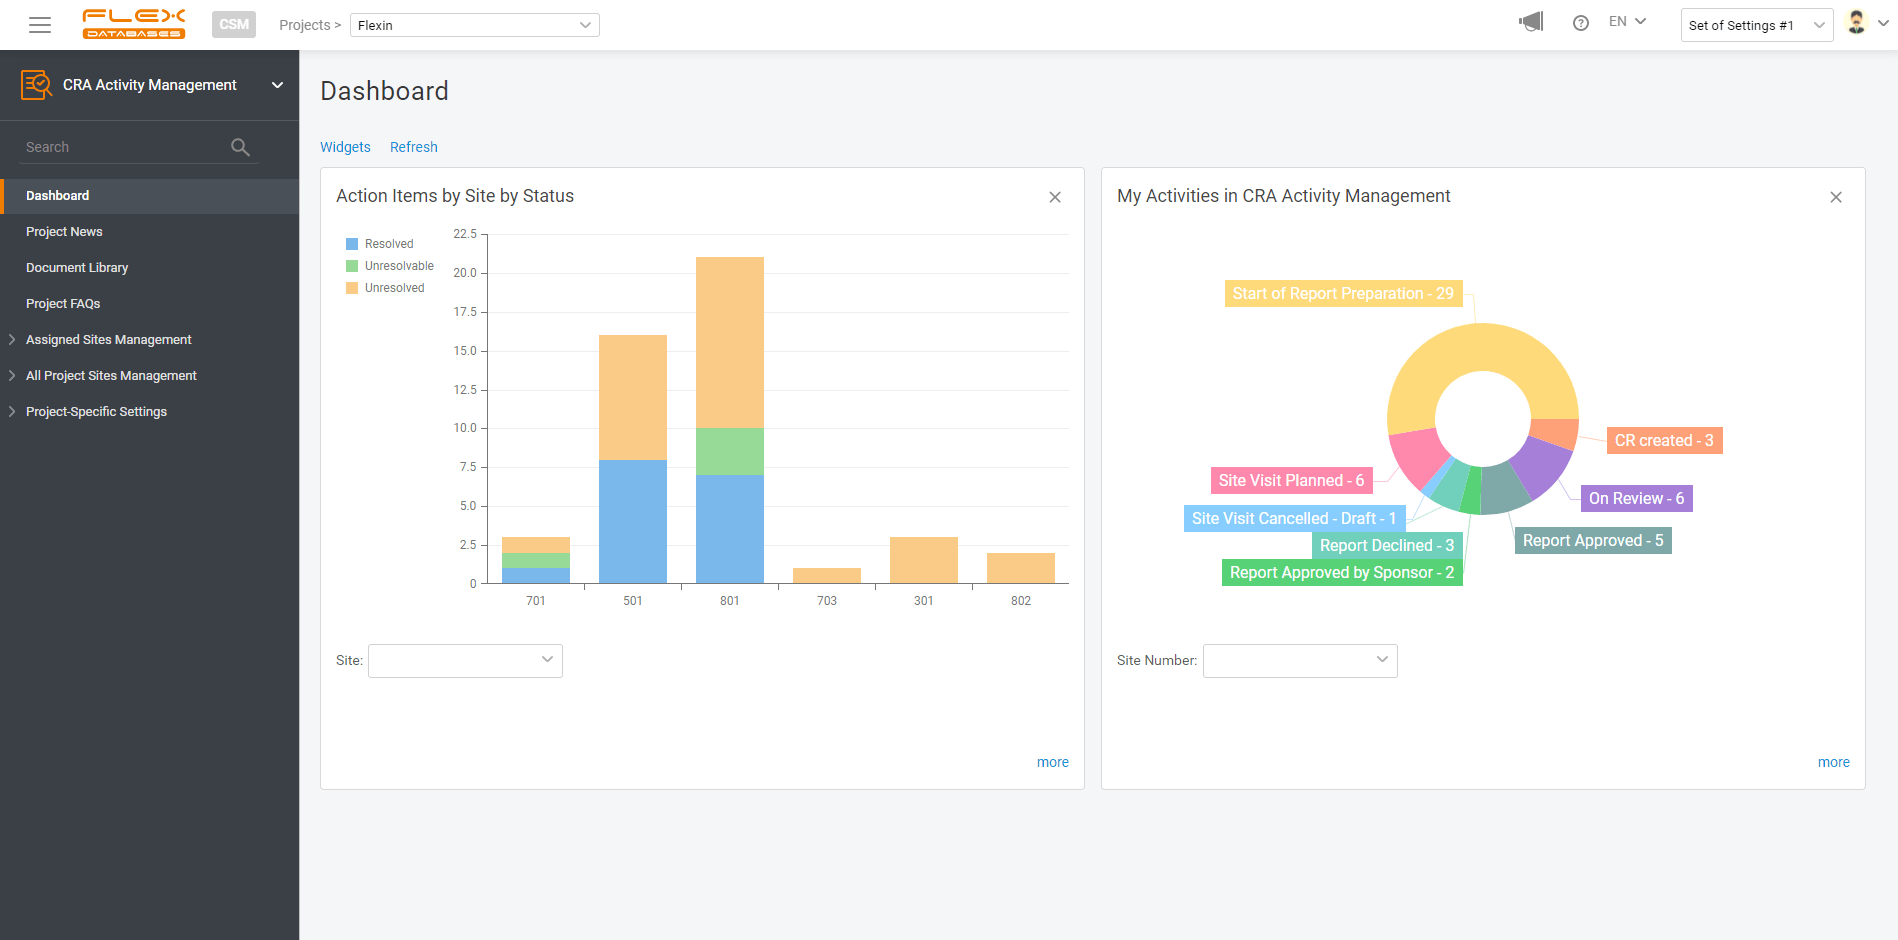
So, here’s the deal: with any data point in our system, you can make a report and visualize your data. And it’s free. And it takes just a few clicks to create.
How it works:
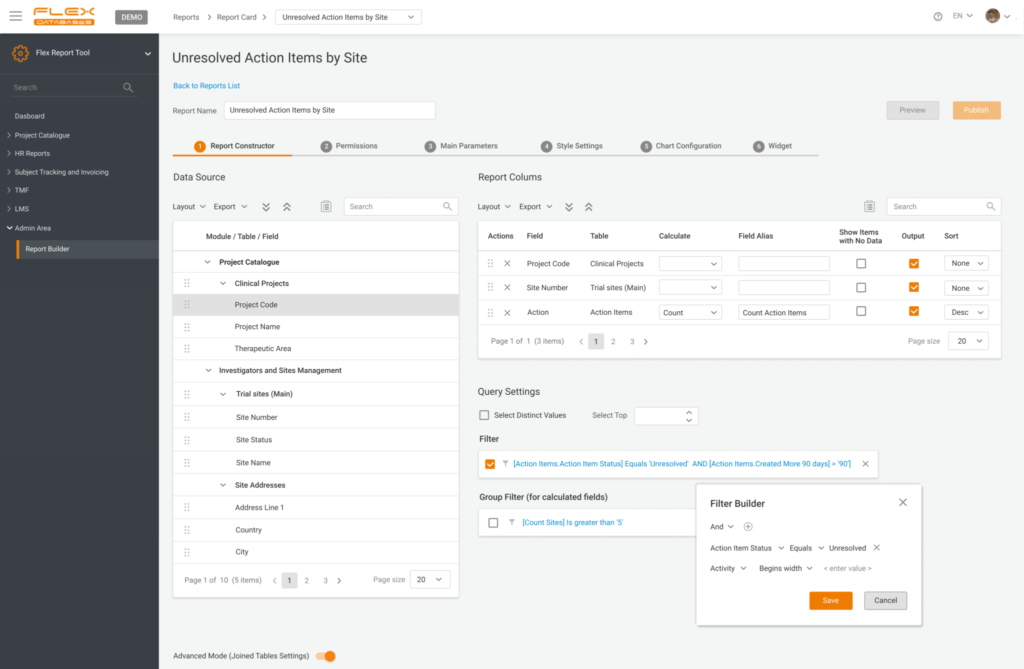
Step 1: Select data sources
- Any field in our system is a source
- You can pick as many as you want from as many tables as you wish – cross-reporting is a thing in our case
- There are zero restrictions on types of data to combine
- You are not limited to flat reports – add calculations to any field to obtain a SUM or average values
- Ready for something advanced? Run a direct SQL query or add custom columns based on our pre-defined formulas
- In the end, add grouping or filters to shape it however you like
2. Provide permissions
You can share your custom reports with anyone you like, from your study team to the whole company, or save it for yourself and keep it handy on the dashboard.
3. Pick your style
Visual representation is essential, so there are still no limits – you can pick any chart type, play with legend, data labels, etc.

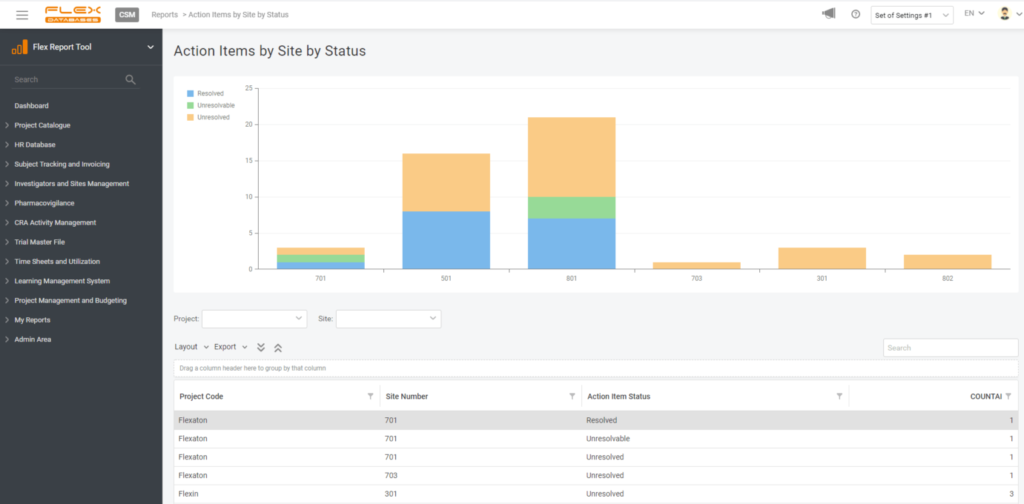
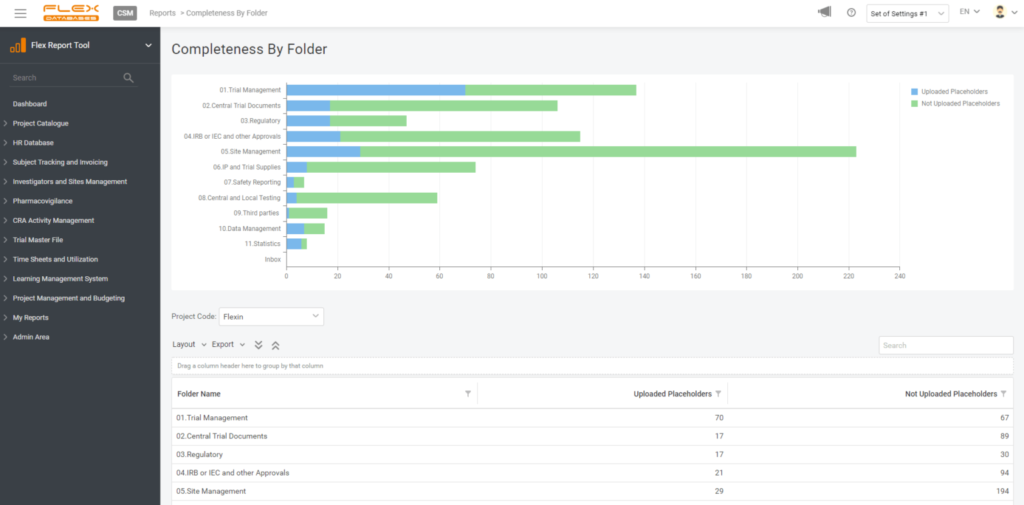
4. Create a widget
If you wish, you can create a widget for your report to always keep it handy on your dashboard. You are free to pick any number of widgets to display and any dashboards to have this report pinned, so it won’t follow you around when there’s no need.
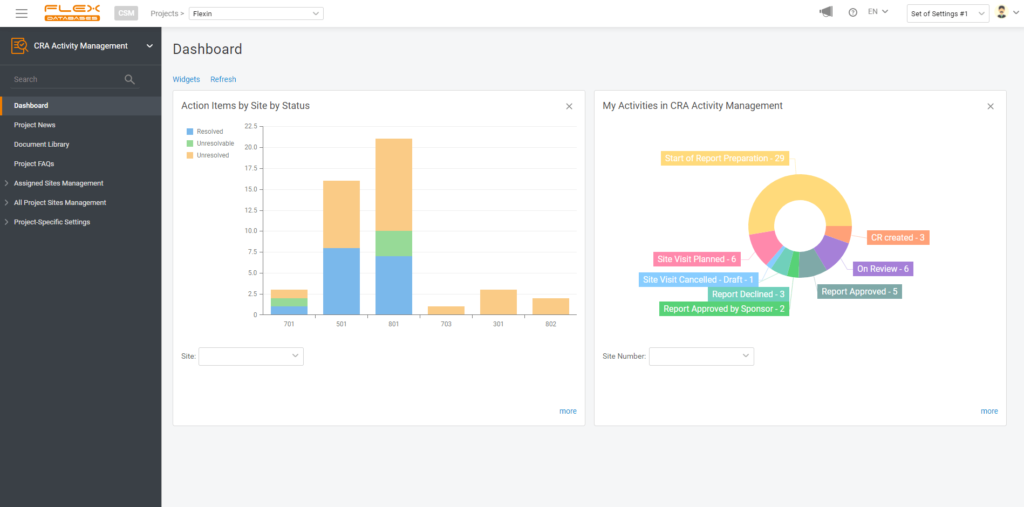
Let’s summarize the abilities of the Flex Databases Report Tool:
- You can create a report from any data in the system
- Style the report however you want
- And add it as a widget if you’d like
- And it’s free for all of our clients
Here’s an offer to test it out: send us a request to bd@flexdatabases.com or simply request a demo via the button on top of the page
