KPI reports – get a complete overview of what’s essential at a glance
September 22, 2023

Nowadays, there’s no such thing as too much optimization in team or process management. That’s why we decided to get you another step ahead with our KPI reports – multi-component reports that’ll help you focus everything essential on one screen.
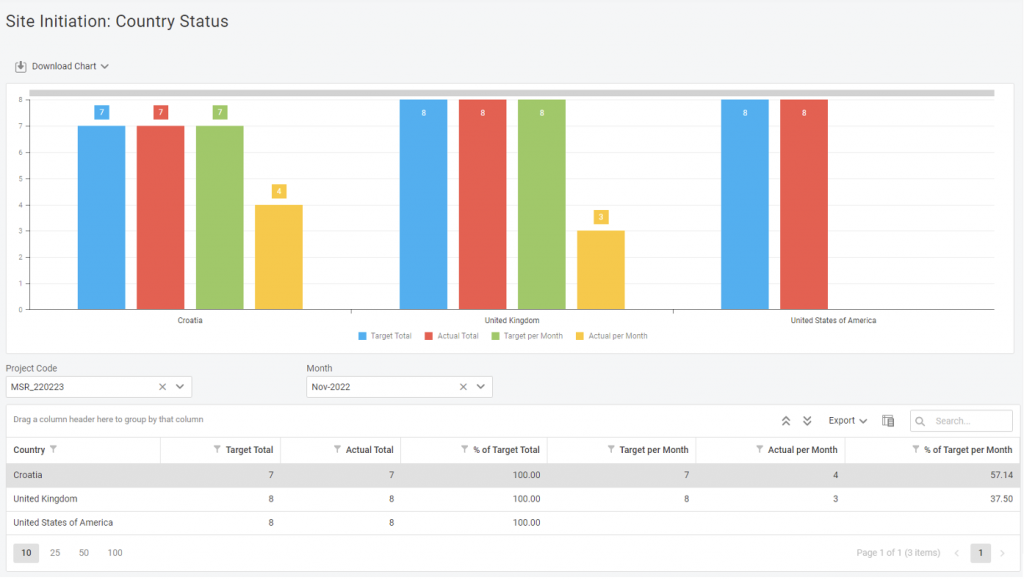
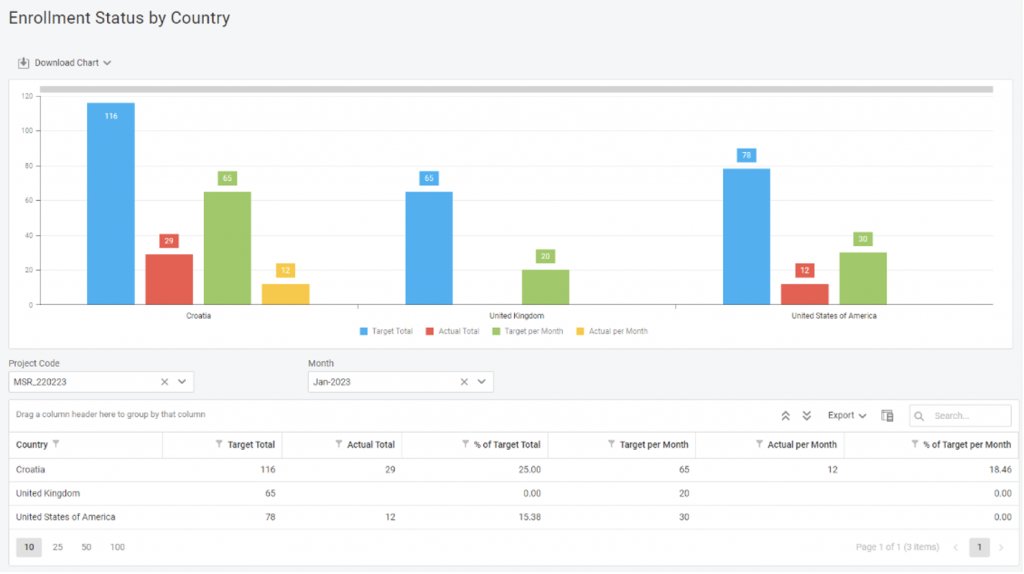
We’ll look at Site Initiation and Enrollment reports for today’s exercise.
In one report, you can see the entire progress of your site initiation process, with targets defined at total and monthly levels. What’s usually been a whole collection of different graphs is now in one – and you can see when and if something goes wrong.

The same goes for the Enrollment KPI report. All countries have total & monthly targets, alongside completion percentage, so you’ll have to look just once to see if something’s wrong.
Those two are just simple examples of what’s already in there and what’s coming soon. Start your day being informed of where to troubleshoot or what to be proud of and report to your upper management, not wasting time manually putting the data together.
To learn more about KPI reports or anything else within the system, please request a demo via the form on top of the page or contact us at bd@flexdatabases.com.


