How Flex Databases Report Tool helps to get 100% of your data work

September 23, 2021

How Flex Databases Report Tool helps to get 100% of your data work

So, here’s the deal: with any data point in our system, you can make a report and visualize your data. And it’s free. And it takes just a few clicks to create. 

How it works:

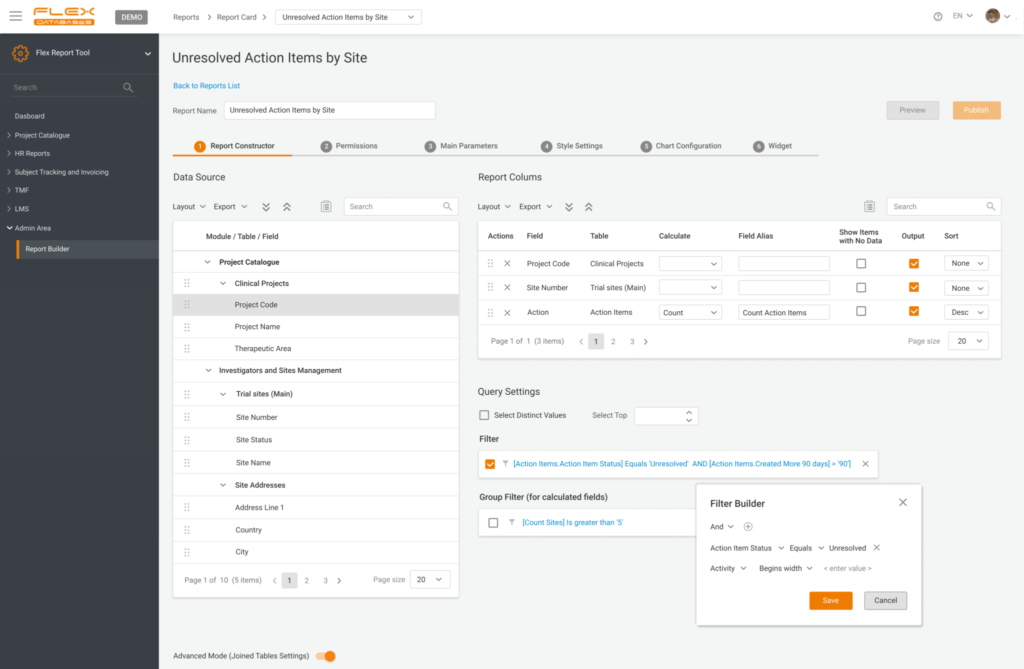
Step 1: Select data sources  

  • Any field in our system is a source
  • You can pick as many as you want from as many tables as you wish – cross-reporting is a thing in our case
  • There are zero restrictions on types of data to combine
  • You are not limited to flat reports – add calculations to any field to obtain a SUM or average values
  • Ready for something advanced? Run a direct SQL query or add custom columns based on our pre-defined formulas
  • In the end, add grouping or filters to shape it however you like

2. Provide permissions

You can share your custom reports with anyone you like, from your study team to the whole company, or save it for yourself and keep it handy on the dashboard. 
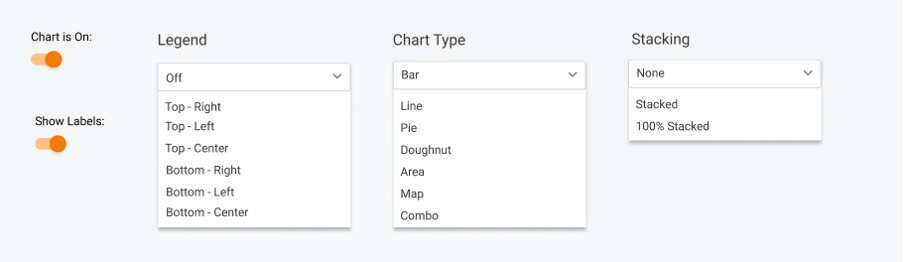
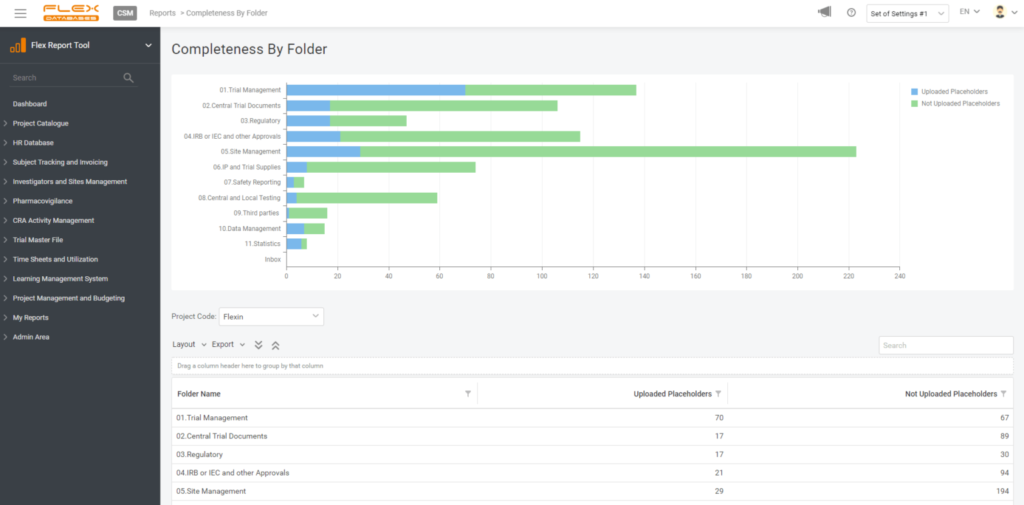
3. Pick your style

Visual representation is essential, so there are still no limits – you can pick any chart type, play with legend, data labels, etc. 
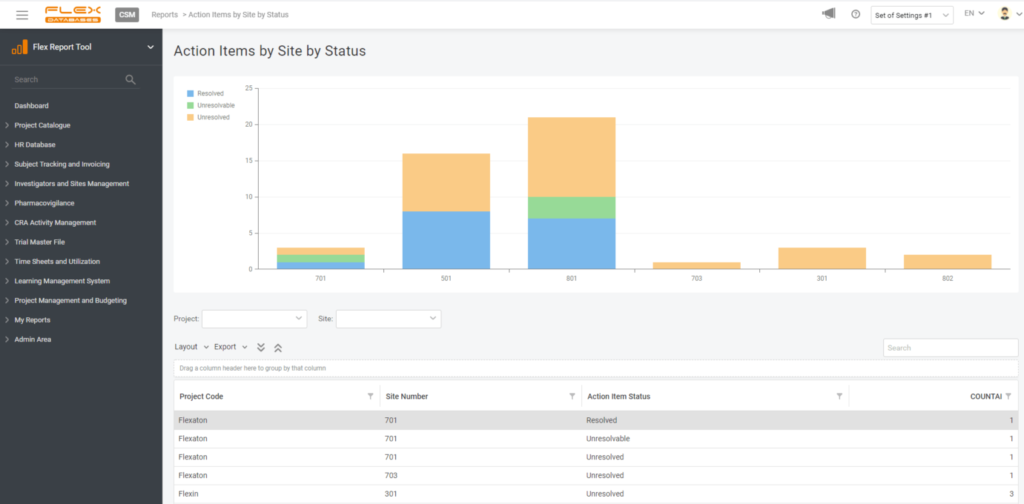
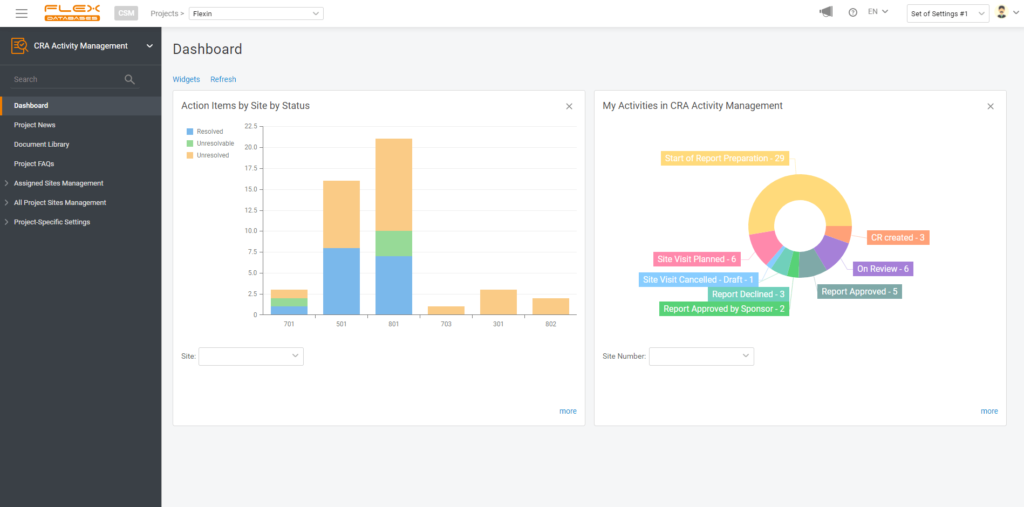
4. Create a widget

If you wish, you can create a widget for your report to always keep it handy on your dashboard. You are free to pick any number of widgets to display and any dashboards to have this report pinned, so it won’t follow you around when there’s no need.  

Let’s summarize the abilities of the Flex Databases Report Tool:

  • You can create a report from any data in the system
  • Style the report however you want
  • And add it as a widget if you’d like
  • And it’s free for all of our clients

Here’s an offer to test it out: send us a request to bd@flexdatabases.com or simply request a demo via the button on top of the page

Blog

October 1, 2025
Risk-Based Monitoring with Flex Databases 

Flex Databases combines deep clinical expertise with advanced technology to deliver a smarter approach to trial oversight. Our Risk-Based Monitoring (RBM) framework helps sponsors and CROs focus on what matters most, reduce effort and cost, and make faster, data-driven decisions – supported by Flex Databases’ EDC, central/remote monitoring, and AI analytics.  Why Risk-Based Monitoring?  How […]

September 30, 2025
ICSR Reporting

📑 Tracking regulatory submissions shouldn’t require endless spreadsheets.But for many PV teams, managing ICSR reporting across agencies means manual tracking, external task lists, and risk of missed deadlines. With Flex Databases’ improved Pharmacovigilance Submissions Tracker, everything is now in one place: ✔ Define flexible submission rules by drug, project, and conditions✔ Configure statuses to match […]

Query Chat: Smarter Way to Manage Data Issues in Monitoring

Managing monitoring activities often means juggling multiple people, documents, and communication channels. Without the right tools, discussions about data discrepancies get lost in emails or chats, review cycles are disrupted, and KPIs are affected by unnecessary report declines. To solve these pains, CRAAM introduces a dedicated Query feature – designed to make handling data issues […]

Subject Tracking & Invoicing – Data Import Wizard.

Cross-site budget setup can turn into hours of manual per-subject cost entry, slowing teams down and creating error risks. With Flex Databases’ Subject Tracking & Invoicing, you can now import Per Subject Costs directly from Excel using the Data Import Wizard. ✔ Speed up site budget setup✔ Reduce manual entry and errors✔ Import across projects […]

Contact us

Get in touch to discuss compliance, implementation, demos, pricing

We are here for all of your questions! Tell us more about yourself and we will organize a tailored live demo to show how you can power up your clinical trials processes with Flex Databases.