Report Tool 2.0 – creating reports is as easy as making your morning coffee
June 10, 2022
Every user of eClinical solutions faces the need for a fast and effective assessment of different kinds of information. Flex Databases Report Tool 2.0 is the best way to get that. Get the answers you need without asking too many questions – simply pick the source data you need, and the system will take care of the rest.
Here are seven cornerstones of our Report Tool, making it the essential for your everyday life:
Best practices
We used best practices to make the Report Tool extremely user-friendly. Each step of report creation is intuitive, and it’s like you are simply building a diagram in PowerPoint or creating a table in Excel, but easier.
Configurable reports
Nobody knows your needs and projects better than you. That’s why our tool is not just about predefined types of reports but about you and the ability to create any kind of report to your specific needs.
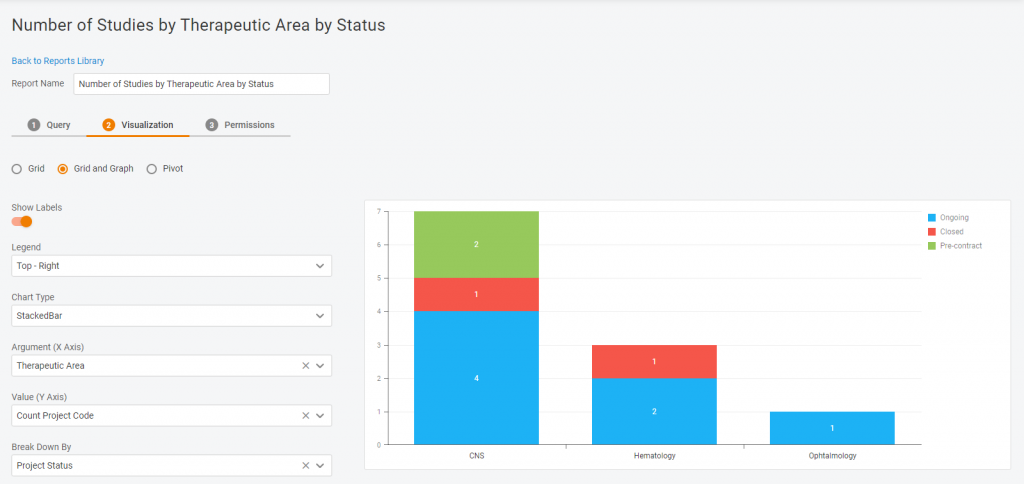
Preview during report creation
A picture is worth a thousand words – that is why you can see your report during its development. For example, when you create a pie diagram – you would see shares appearing on your screen while adding the data to the table in real time. Like baking, but you don’t have to worry about the result.
Multiple visualization options
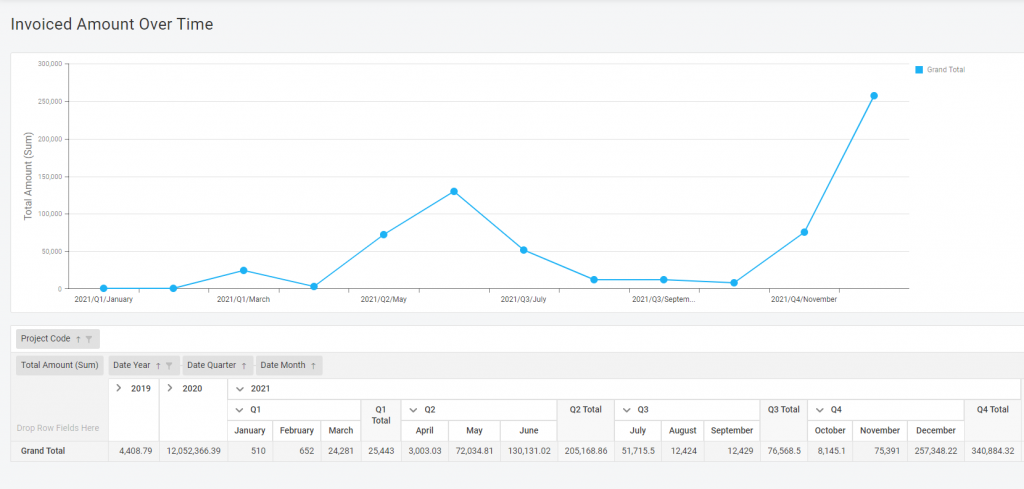
Do you need a chart or a diagram? A plain table or a pivot one? We have all the options available in our Report Tool. It’s for you to decide how your data will look!
No IT background required
Some report tools require you to be an SQL genius. Not in our case. In Report Tool 2.0, any background is enough: if you are a non-IT person and far from BI, you will be able to create any report you need. Though, if you are into IT and BI – you will be able to develop actual monstrous reports going above and beyond.
Various access options
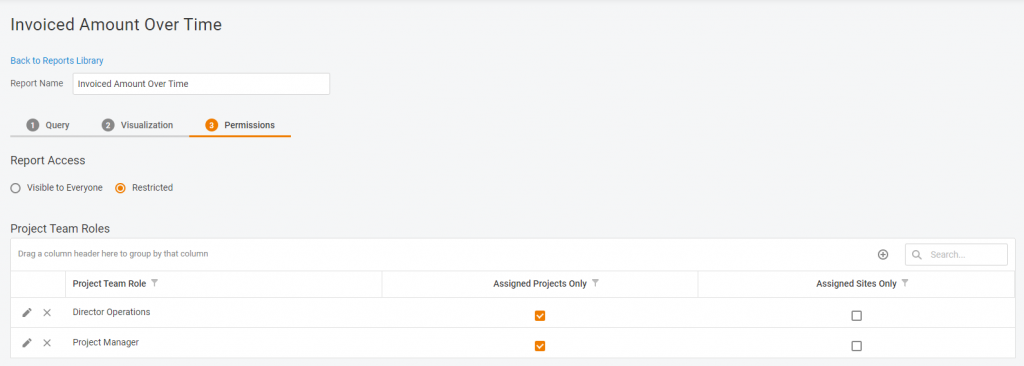
Do you want the report to be available for review & use for all the system users? Or maybe you want to share it with specific sites or project teams? Or even keep it in the family by sharing only with your direct subordinates? Anything’s possible.
Adaptability
You can always go back to the report you’ve created to make a copy or change it. Do whatever you like with a copy – add more fields, change the visualization, e.g., from the grid to pie chart or pivot – and you will have different visualizations of the same data to compare and choose best. Or if you feel like something’s missing – you can always change that.
Our Report Tool was cool, but now it’s even better. That’s the only approach we use for Flex Databases system – send us a demo request to bd@flexdatabases.com to see it in action!